
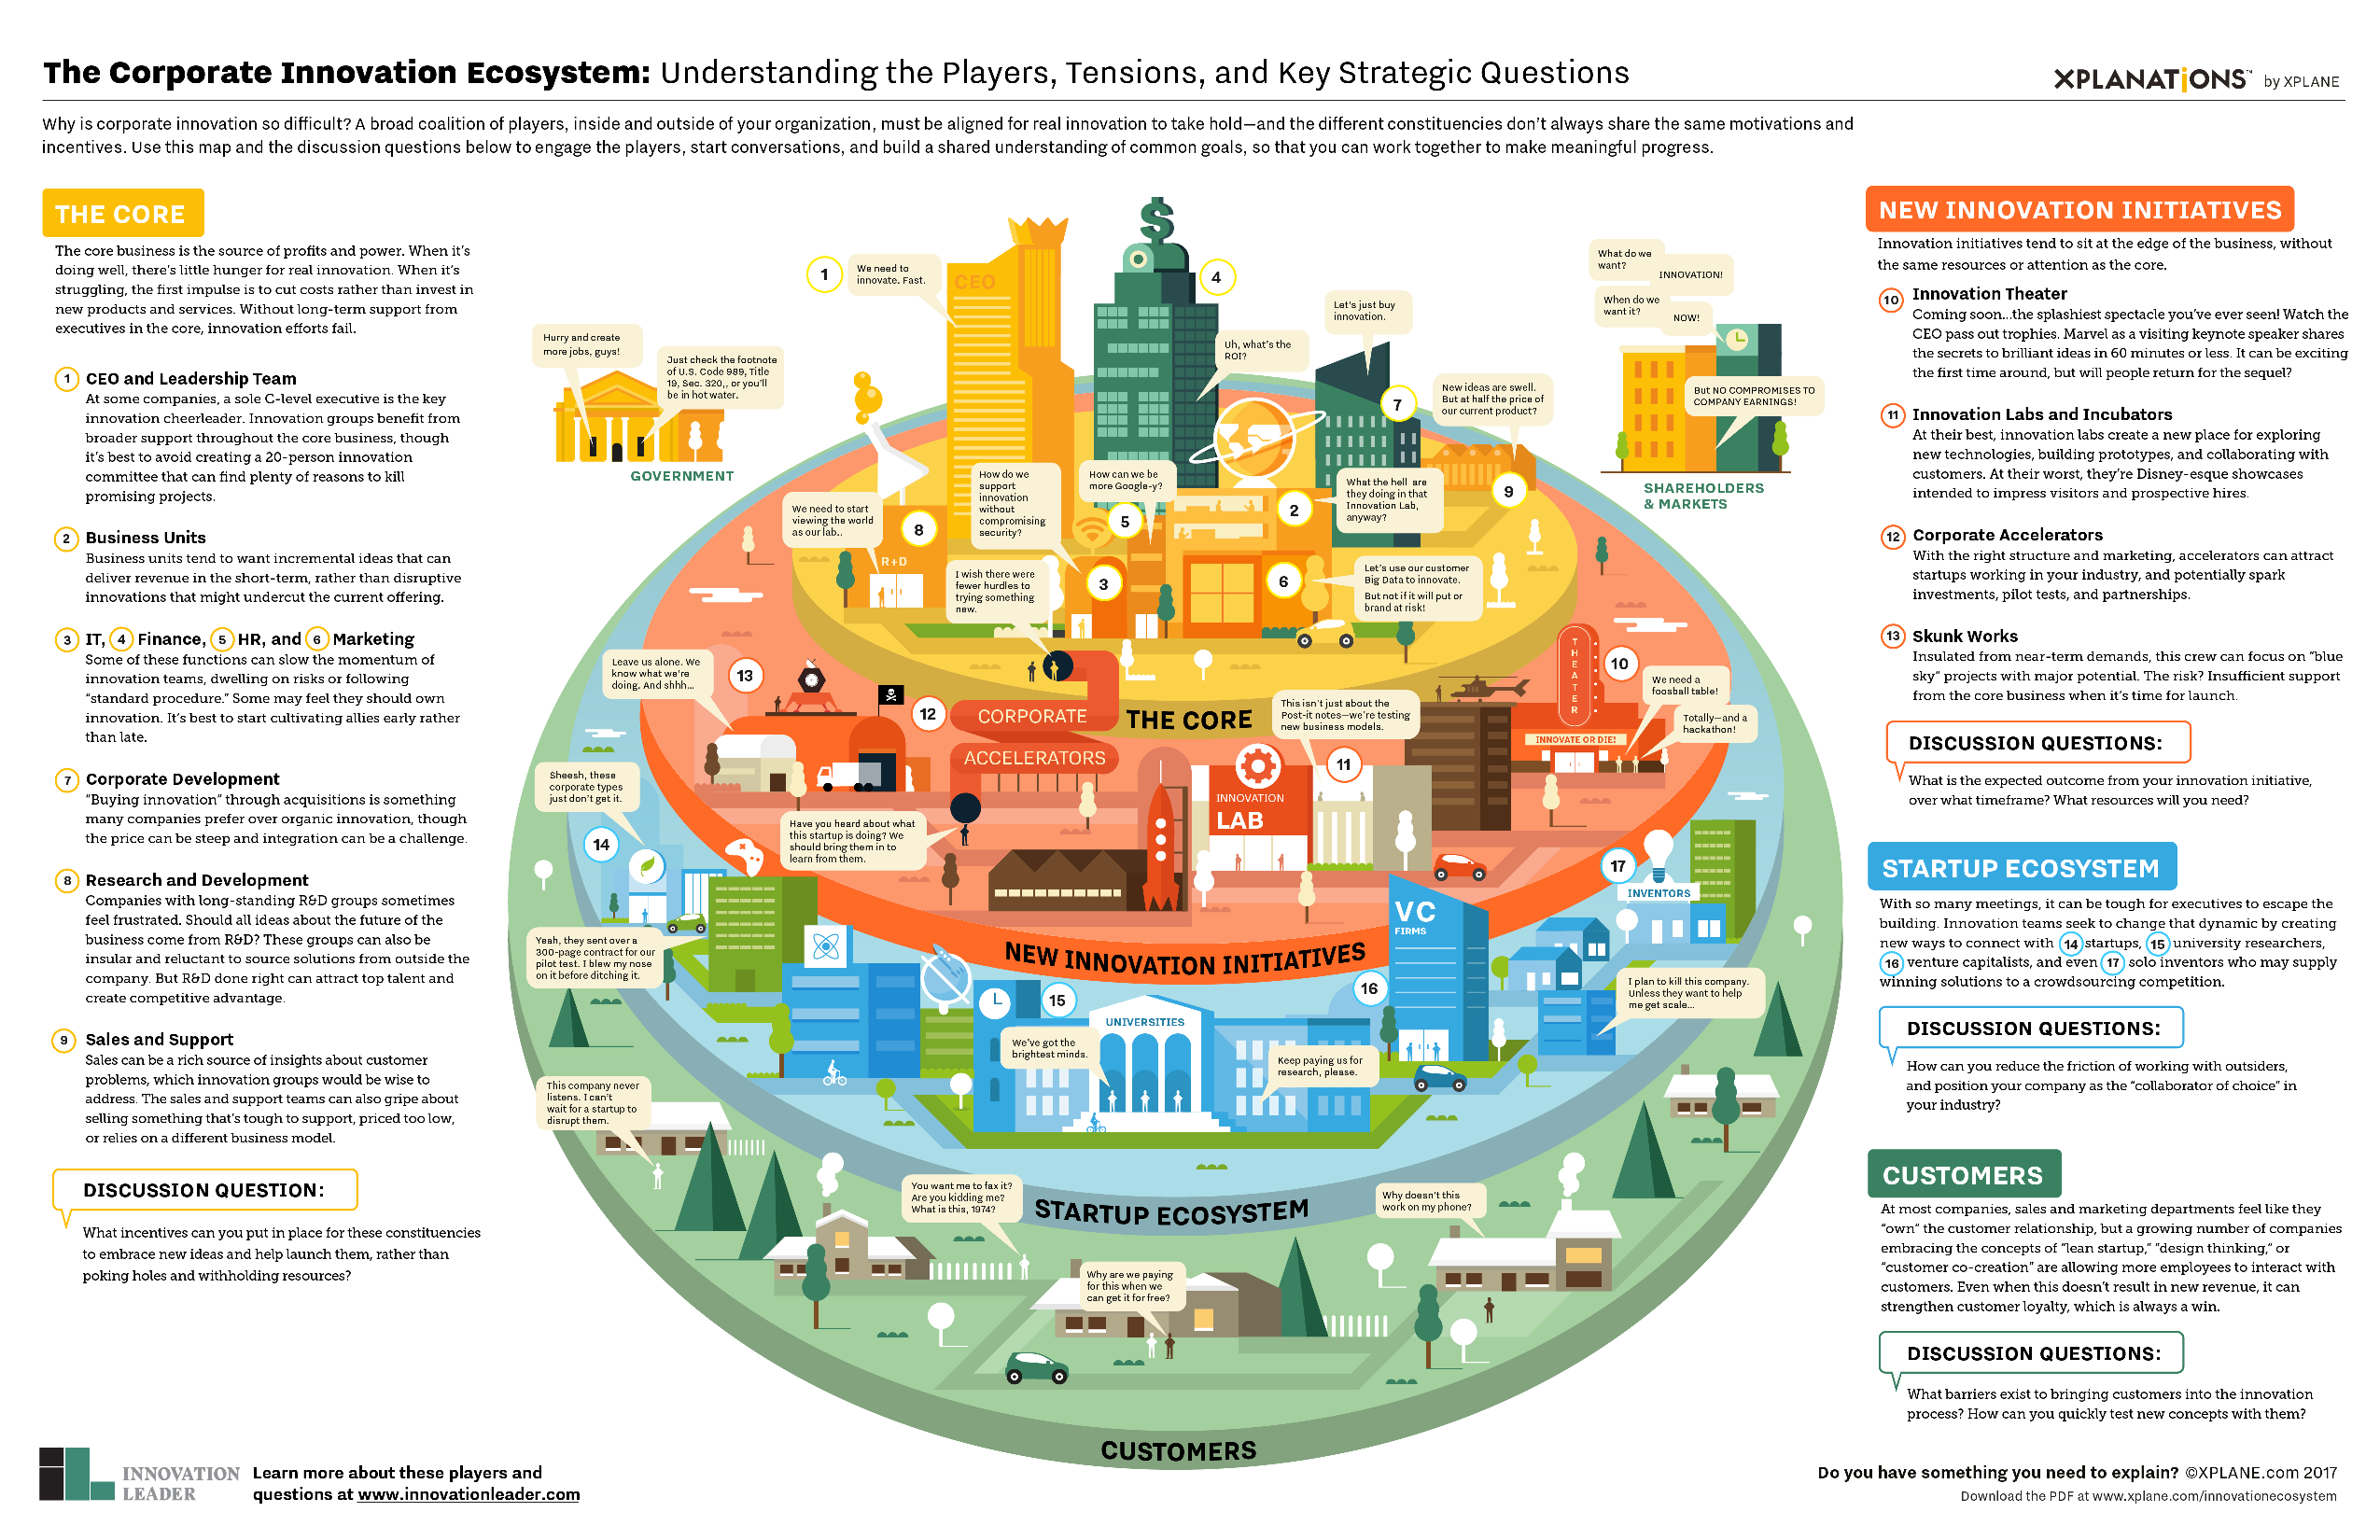
Image: Ecosystem map developed with Innovation Leader. Buy a quality 24×36-inch print.
The visual XPLANATiON above is the first map in the Innovation Illustrated series. Check out the full series here.
An XPLANATiON is an information landscape.
One big challenge in developing and growing an ecosystem is collective sense-making. How does a group of people with shared interests come to conceive of themselves as an ecosystem, and how do they start to make sense of their common ground and begin to navigate it successfully?
This is top-of-mind for me because of my work with information landscapes. I have found that you can involve a group of people in the process of visualizing their common ground, working with them to develop a shared picture that evolves in iterations over time.
We start with a napkin sketch, like a snowball at the top of a hill — and then we “roll” it by showing it to more and more people, asking them questions about it, and incorporating their feedback in next-step sketches, you can evolve the visualization.
Each iteration gains more momentum, more buy-in, and the picture becomes more clear and concrete to everyone involved.
One example is this innovation ecosystem sketch, which evolved as a through many iterations in dialogues with corporate innovation executives, researchers, entrepreneurs and others before being somewhat finalized in this map.
Visual explanations take advantage of our natural, intuitive visual thinking skills.
We can easily read a landscape, in real life or in art, quickly scanning not only the information it presents, but the ease or difficulty of the terrain, the softness or harshness of the weather, the climate, the light, time of day, and so on.
Landscapes can be welcoming or threatening, whimsical or deadly serious. They convey not just information but mood and emotion. And they have metaphorical power too.
For example, the innovation ecosystem above is intended for innovation leaders in large organizations, as well as entrepreneurs in startups and tech companies. Its tone is clean and clear, and the bright colors are like Lego blocks, conveying the idea that innovation is about creating, and it can be fun.
Visual landscapes are a great way to package a selling story, especially when used as a tool for conversations about possibilities. There is a gap between simple aspirational billboards, designed to attract attention, and detailed blueprints and white papers, which can be overwhelming and often go unread.
Before they go deep, people — especially time-challenged decision-makers — need summary/overview explanations that are engaging and accessible. This is the place for visual explanations.
Not everyone understands this.

Image: Selling story for Alvaria, Inc., shared with permission.
Visual information landscapes are older than the pyramids, older than written language, and perhaps even earlier than spoken language. Some remnants remain: glorious cave paintings where majestic animals seem to overwhelm puny human stick figures. We can only guess what stories were told to accompany these images, by flickering torchlight.
From the cave paintings in Lascaux, to ancient China, to medieval manuscripts, visual information landscapes have played roles in storytelling, poetry, teaching, and spirituality.
Every time someone scratches a crude diagram with a stick in the sand, scribbles a business idea on a napkin, or demonstrates how to tie a knot, they are using this ancient technique that powers the human ability to understand and communicate complex or potentially confusing information.
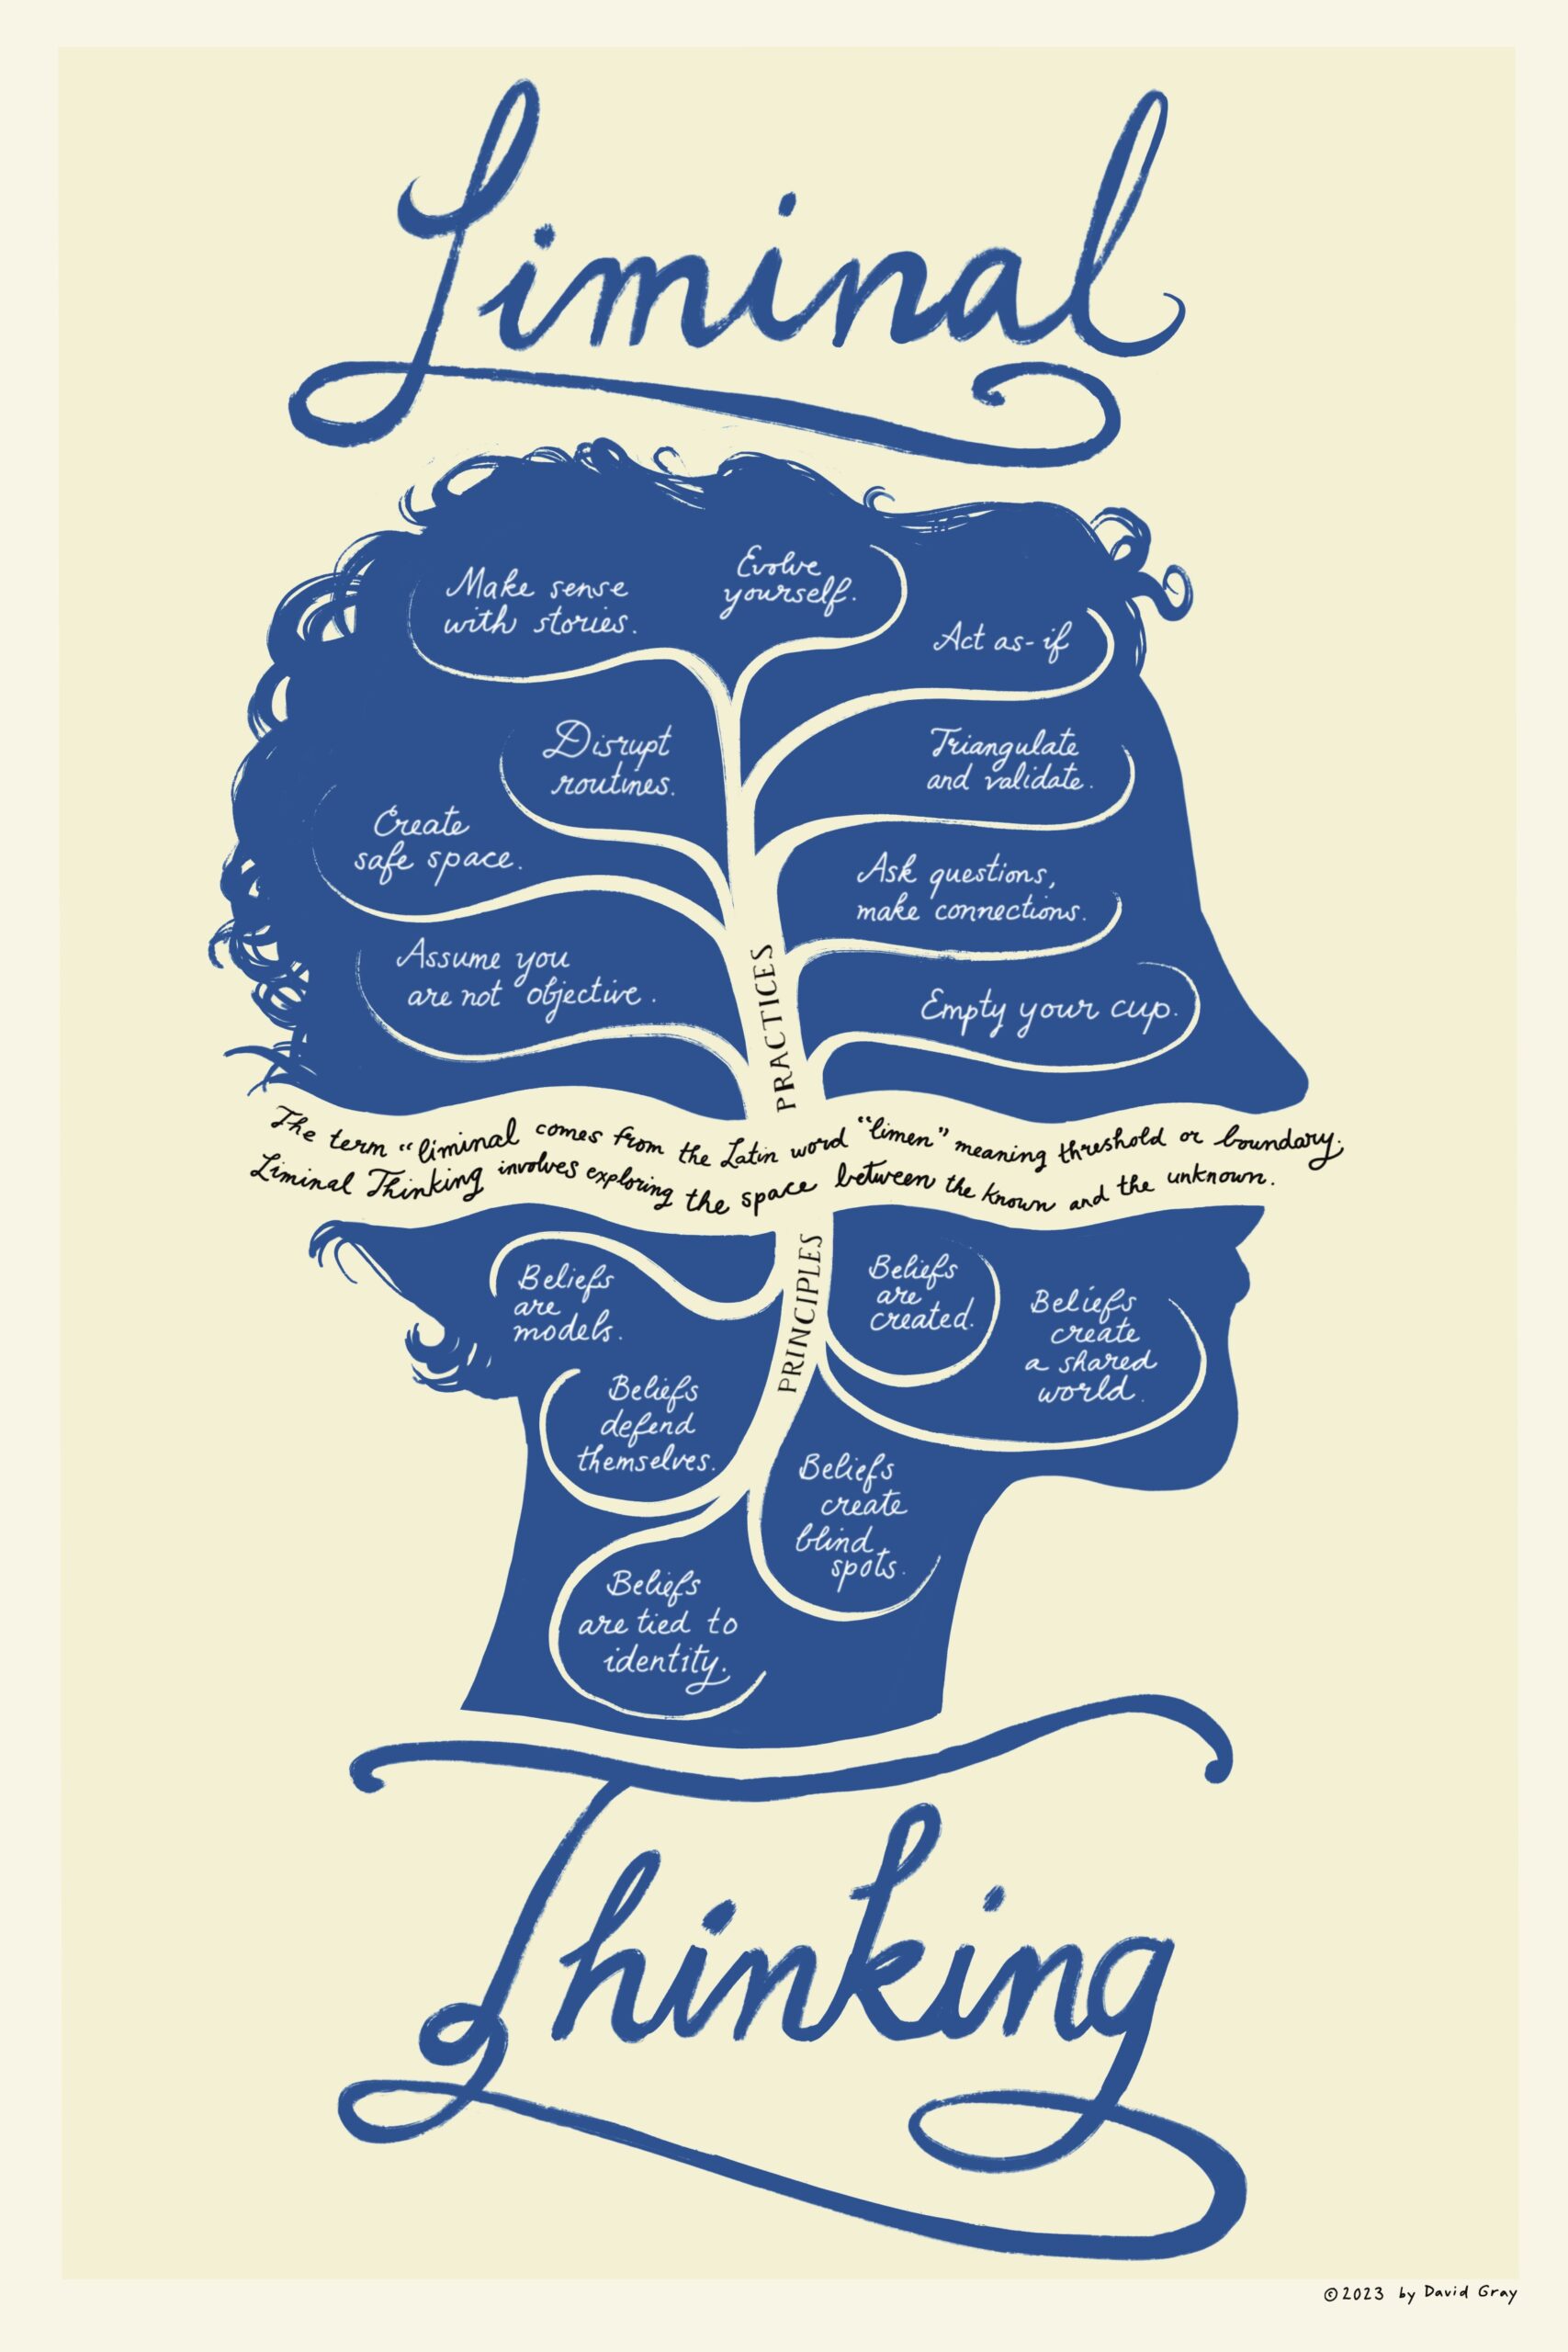
Image: visual summary of my book, Liminal Thinking.
The image above is very different. For one thing, it’s more personal, since it’s a summary of some key points from my book, Liminal Thinking. The story it tells is more introspective and thoughtful. If the corporate ecosystem is a landscape of Legoland, this one is more like a misty glen.
You may know by now that I have exited my company, XPLANE, after many years of hard, fun work with companies large and small. My focus these days is on more personal work.
I especially enjoy visual storytelling and information landscapes like these, so please do let me know if you have something I could help you visualize.
You can use this powerful method to clearly explain how things work and why they matter.
I can help.